Introducing NCHH’s State Healthy Housing Fact Sheets: EPA Region 10
by Sarah Goodwin
We’ve reached the end of this 10-part blog series. You may also be interested in reading about EPA Region 1, Region 2, Region 3, Region 4, Region 5, Region 6, Region 7, Region 8, and Region 9.
Throughout 2018, we’ve shared highlights of our state fact sheets by EPA region, one per month. In October, we’ve at long last reached our final installment: Region 10, which includes Alaska, Idaho, Oregon, and Washington.
Notable facts from this region include:
- The percentage of homes built before 1978 ranges from 42% (Alaska) to 55% (Oregon). This is a lower range than some of the other regions we’ve looked at, but half of your housing stock with the risk of containing lead-based paint is not nothing.
- However, despite this and other risk factors, only Oregon and Washington have reported blood lead testing results to the CDC in recent years:
- In 2015, 282 Oregon children tested with blood lead levels of 5 µg/dL or more.
- In 2015, 417 Washington children tested with blood lead levels of 5 µg/dL or more; less than 3% of children were screened.
- In 2012, only 1.4% of children in Alaska were tested.
- Idaho has no recent testing data available. An estimated 78% of high-risk children in Ada County alone are not being tested. And since we’ve begun publicizing these fact sheets, a coalition member has made us aware of the particular challenges faced within the Bunker Hill Superfund Site in Idaho.
- Risk of radon is a consistent fact across this region, both in terms of predicted levels and reported household tests:
- Oregon has 21 ZIP codes considered high risk, with up to 70% of homes testing above the EPA action level.
- Idaho has 18 counties with predicted above-average radon levels; in nine counties, more than 50% of test results were above the action level.
- In Alaska, 21% of tests had levels above the action level.
- In Washington, 17% of tests had levels above the action level.
- An average of 18 people died each year from carbon monoxide exposure in Oregon between 2011 and 2015; in Washington, 17 people died annually over this period.
- Unintentional falls were responsible for the deaths of 769 adults over 65 in 2015 between Alaska, Oregon, and Washington. In Idaho, 201 older adults died from falls in 2014. And in Alaska alone, one out of three older adults fall each year.
- Asthma was responsible for significant costs in this region as tallied near the start of this decade:
- An estimated $150 million in direct costs in Alaska in 2012;
- $28 million in charges from 2,000 hospitalizations in Oregon in 2012;
- A total of $73 million in hospitalization costs in Washington in 2010.
Other NCHH Resources
- With funding from the American Public Health Association and the W.K. Kellogg Foundation, NCHH and the George Washington University Milken School of Public Health conducted a series of case studies on healthcare financing for healthy homes. Case study seven examined Medicaid reimbursement for home-based asthma services in Washington.
- NCHH is currently producing a series of case studies on alternative financing mechanisms, funded by the W.K. Kellogg Foundation, including one that describes Multnomah County’s Lead Poisoning Prevention Program in Oregon.
- Use this list of building code resources to identify building codes in your state and locality.
But Wait, There’s More!
Now that we’ve finally finished this blog series, it’s time to…do it all over again! No, we won’t be rewriting all these blogs, but we will be releasing new versions of the state fact sheets. Come find our booth at the American Public Health Association’s Annual Meeting in a few weeks to see the first display of the 2018 State Healthy Housing Fact Sheets. Or keep an eye on your inbox and our social media feeds to be alerted when they’re published online.
The 2018 fact sheets have some new features we’re excited to share with you: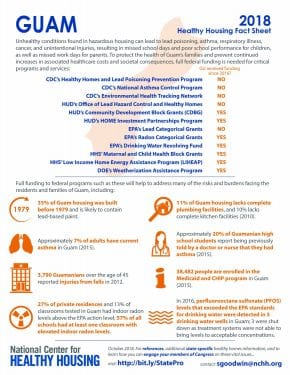
- We’ve started tracking the EPA Radon Categorical Grants, which we also covered on our agency fact sheet. This brings the number of federal programs included in the state fact sheets up to 12. All but five of the subjects of our fact sheets have received funding from this program since 2016.
- We are super excited to premiere a Guam Healthy Housing Fact Sheet for the first time! It’s not an area where we traditionally have many contacts, so this was a learning experience for us. Guam is our second territorial fact sheet and the 54th overall.
- Because of the increases in federal funding for healthy homes this year, some of the programs we track were able to expand. Check the fact sheets to see if some more states got funding.
- Finally, we noticed that the CDC’s Environmental Health Tracking Network, from which some states receive funding, upgraded their website this year. These state tracking networks are some of our best sources for the fact sheets and often provide incredibly detailed data. I encourage you to check them out if you haven’t done so.
Thanks for following this blog series all year – when we came up with this plan back in January, we had no idea how popular they would turn out to be!
 Sarah Goodwin joined NCHH as a policy analyst in June 2017. She previously served NCHH as a policy intern, helping to establish and run the Find It, Fix It, Fund It lead action drive and its work groups. She holds a Bachelor of Arts degree in Interdisciplinary Studies: Communications, Legal Institutions, Economics, and Government from American University.